

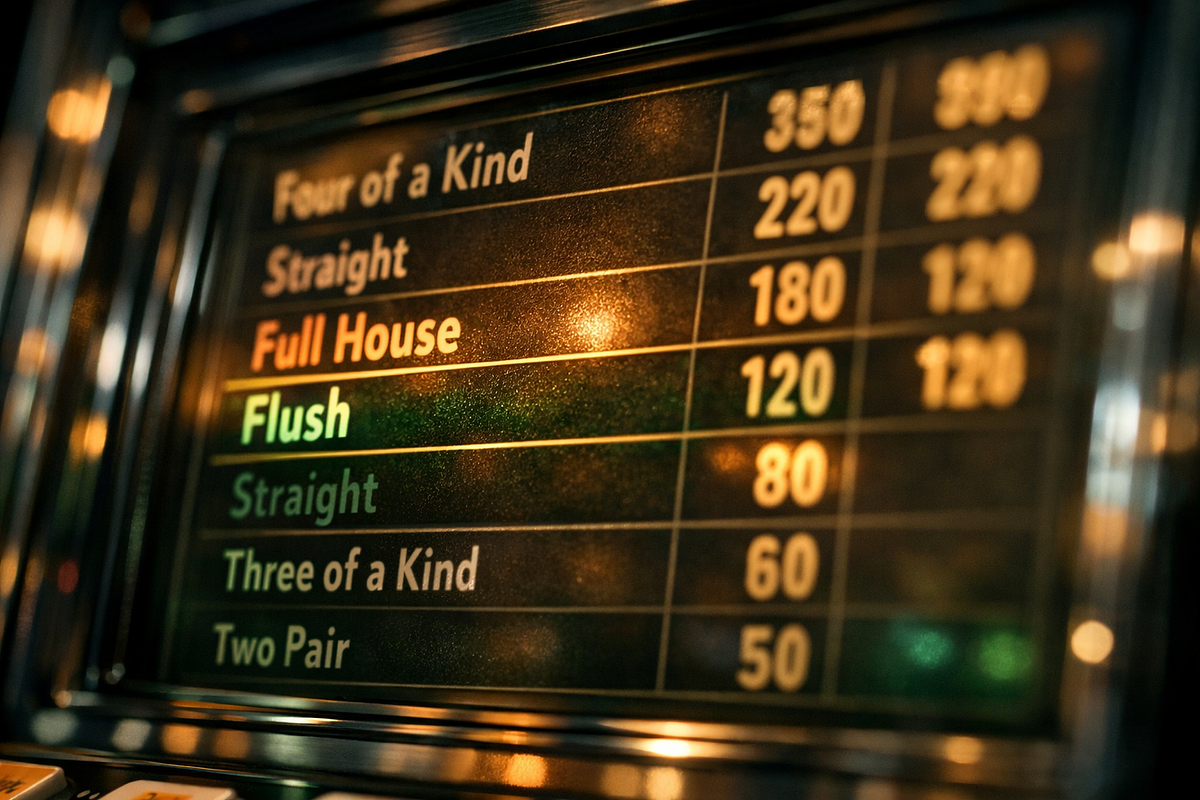
Two numbers on a video poker pay table tell you most of what you need to know about a machine before you sit down. The payouts for the full house and the flush determine the bulk of the game’s long-run return. Cut either one by a single unit and the overall return drops by roughly 1.1 percentage points. That adds up fast because those hands come up often. This page explains how to read those numbers and what they mean in practice, so you can size up any machine before you put money in.
The full house and flush lines carry so much weight because those hands hit often enough that even a small payout cut compounds across every session. Reading a machine’s pay table before playing means translating those two numbers into a real picture of what the game returns.
The Paytable Notation That Signals a Machine’s Return
Video poker paytable variants are identified by a two-number shorthand, like 9/6 or 8/5. Those numbers aren’t arbitrary labels. They point to the pay lines casinos adjust most often, and their values determine the game’s overall return to the player. Once you understand this notation, comparing machines and variants becomes straightforward.
The first number is the per-coin payout on the full house. The second is the per-coin payout on the flush. These are the two lines operators adjust most often, which is why the industry settled on them as the shorthand for identifying a paytable variant.
Full houses and flushes come up often enough in normal play that even a one-unit cut on either line adds up to a real shift in the game’s total return. A rare hand like a straight flush contributes so little to overall return that changing its payout barely moves the needle. The full house and flush lines sit in a frequency range where small changes carry a lot of weight.
When you see a notation like 9/6 on a strategy site, in a forum, or on the machine itself, those two numbers tell you the game’s expected return under optimal play. You’re not just reading two isolated payouts. You’re reading the game’s return characteristics.
A single named game like Jacks or Better can exist in different paytable configurations across different machines and casinos at the same time. The paytable is a configurable part of the machine’s software, so an operator can change it without touching the game’s name, artwork, or cabinet. Nothing on the outside of the machine tells you which configuration is loaded.
Operators can also change the paytable on an existing machine over time, so a machine that offered a good configuration on one visit may carry a different one on your next visit. The game’s name is not a reliable indicator of its return. The only way to confirm which configuration is running is to read the paytable on the machine face before you put money in.
How a Single-Unit Payout Change Reshapes Return-to-Player
Cuts to individual pay lines produce predictable, measurable drops in a game’s overall return-to-player. The math is straightforward: each affected hand occurs at a known frequency over long play, so any change to its payout multiplies across every occurrence. That’s what makes the shorthand notation a reliable signal of expected return rather than just a label.
For every one-unit reduction on a pay line, the game’s overall return drops by about 1.1 percentage points. This happens because the affected hand appears at a statistically stable frequency over a large number of hands. The payout cut applies to every occurrence, so the total cost to the player equals the hand’s frequency multiplied by the size of the reduction. A change that looks like one number on the machine face is a persistent drain applied across thousands of hands. If you see the full house line drop from nine to eight coins, that’s a meaningful reduction in expected return, not a minor formatting difference.
The table below maps the most common shorthand notations to their return-to-player figures under expert play. It covers the main variants of Jacks or Better, from the full-pay benchmark down to one of the worst configurations commonly found on casino floors. It also includes both the full-pay and short-pay versions of a bonus-style game to show how the same per-unit math works across different game families.
| Paytable Variant | Base Game Type | Return-to-Player with Expert Play |
|---|---|---|
| 9/6 | Jacks or Better | 99.54% |
| 9/5 | Jacks or Better | 98.45% |
| 8/6 | Jacks or Better | 98.39% |
| 8/5 | Jacks or Better | 97.29% |
| 6/5 | Jacks or Better (most unfavourable common variant) | 95.00% |
| 10/7 | Double Bonus (full-pay) | 100.17% |
| 9/6 | Double Bonus (short-pay) | 97.80% |
The 9/5 and 8/6 Jacks or Better variants are only 0.06 percentage points apart in return, even though their shorthand labels look different. That near-equivalence comes from the fact that the two variants adjust different pay lines in opposite directions. One lowers the full house payout while keeping the flush payout higher; the other does the reverse. The net effect on return is almost identical because the frequency-weighted cost of losing one unit on the full house line is nearly offset by keeping one unit on the flush line. The practical takeaway: the shorthand notation is a strong but imperfect ranking signal. Two variants with different labels can sit at nearly the same return, while two variants whose labels differ by the same numerical distance on a different line can produce a much bigger gap, because the hand frequencies behind each line aren’t equal.
Distinguishing Full-Pay from Short-Pay Configurations at the Machine
Understanding the math is only useful if you can pull the relevant numbers off a machine before putting money in. “Full-pay” and “short-pay” refer to specific, measurable benchmark configurations. They’re not vague descriptions of how generous a machine feels. Reading those configurations off the machine face is a separate skill from understanding what the numbers mean once you’ve read them.
Full-pay means the highest-return configuration of a given game. It’s the benchmark everything else gets measured against. For Jacks or Better, the full-pay benchmark is the 9/6 configuration. For Double Bonus, it’s the 10/7 configuration. Any configuration where one or more pay lines fall below those benchmarks is a short-pay configuration.
The full-pay designation comes entirely from the mathematical return the paytable produces under optimal play, not from the machine’s name, its artwork, or any label a casino puts on it. A machine can say “Jacks or Better” and show familiar graphics while running a short-pay paytable. Full-pay and short-pay describe a measurable property of the paytable itself, one you can verify by reading the pay lines on the machine face before any money changes hands.
The paytable is displayed on the machine face and is visible before you insert any money. The game’s name alone doesn’t confirm the configuration. Only the paytable numbers do. Here’s what to check to identify whether a machine is running a full-pay or short-pay configuration.
- The full house line, Find the per-coin payout for a full house and check whether it matches the full-pay benchmark for the game you’re looking at. The full house line is the most commonly adjusted value by casino operators and is the first number in the standard shorthand notation.
- The flush line, Find the per-coin payout for a flush. This is the second most commonly adjusted line and the second number in the shorthand notation. Together with the full house line, it identifies the variant at a glance.
- The high-value hand lines, Check the payouts for the royal flush, straight flush, four-of-a-kind, and straight. Any of these lines can be adjusted by operators, so a machine that shows the correct full house and flush payouts may still have cuts elsewhere on the paytable.
- The single-coin versus max-coin columns, Confirm which column applies to the bet size you’re playing. Paytables display payouts scaled to the number of coins wagered, and reading the wrong column gives you an inaccurate picture of the per-coin return for your intended bet.
How Paytable Changes Shift Optimal Playing Strategy
The mathematically correct way to play any given hand in video poker depends on the paytable currently running on that machine. A strategy chart built for one variant uses that variant’s specific payouts to calculate expected value, so applying it to a different paytable produces decisions that are no longer fully correct. The game name on the cabinet doesn’t determine which strategy applies. The paytable does.
The top-priority decisions on a strategy chart stay stable across paytable variants. A made royal flush or a made straight flush has expected value so far above any alternative that no realistic paytable adjustment changes the correct decision to hold it. The same stability applies to other high-ranking made hands: the margin between holding them and any other option is wide enough that small shifts in individual pay lines can’t close it.
The adjustments concentrate in the lower-priority lines of the chart, where you’re weighing two draws whose expected values are close to each other. In those spots, the expected value of each candidate draw is calculated directly from the payouts of the hands it’s trying to reach. When one of those target payouts changes, even by a single unit, the relative ranking of the two draws can shift, and the correct hold changes with it.
This creates a second cost for a player using a strategy chart from one paytable variant while sitting at a different one. The paytable reduction itself lowers return by reducing what the machine pays on certain hands. The strategy mismatch adds another persistent leak on top of that, because the player is making suboptimal hold decisions at the margin. These two sources of lost return are independent of each other and accumulate at the same time.
The Cumulative Dollar Cost of a Reduced Paytable
Percentage-point differences in return become real dollar figures once you factor in bet size and hands per hour. Multiply those three variables together and you get an expected hourly loss that’s specific to you at that machine, not some abstract average. A paytable variant that looks like a minor configuration detail on the machine face translates directly into a concrete hourly cost.
The formula for expected hourly loss is: hands per hour multiplied by bet size multiplied by the house edge. On a quarter machine returning 99% at 500 hands per hour, that works out to an expected loss of $6.25 per hour. Scale the same formula to a dollar denomination on full-pay 9/6 Jacks or Better expected value, which returns 99.54% and leaves a house edge of 0.46%, at 500 hands per hour, and the expected loss is about $2.30 per hour with optimal strategy.
Apply the same formula to an 8/5 variant, which returns 97.29%, and the house edge jumps to 2.71%. At the same pace and denomination, the expected hourly loss rises in direct proportion to that larger edge. The percentage difference between the two variants doesn’t stay abstract. It multiplies against every hand played and every dollar wagered.
Because the formula scales linearly, betting at higher denominations or playing faster widens the absolute dollar gap between a full-pay and a short-pay machine even when the percentage difference between those two paytables stays fixed. The difference between two paytable variants isn’t a single universal figure. It’s a specific hourly cost determined by your own bet size and pace, calculated fresh each time those inputs change.
We check operator terms, licences and payment details against the casino's own pages and update this content when they change. Read our editorial policy, our transparency statement, or report an error. If gambling stops being fun, see our responsible gambling resources.