

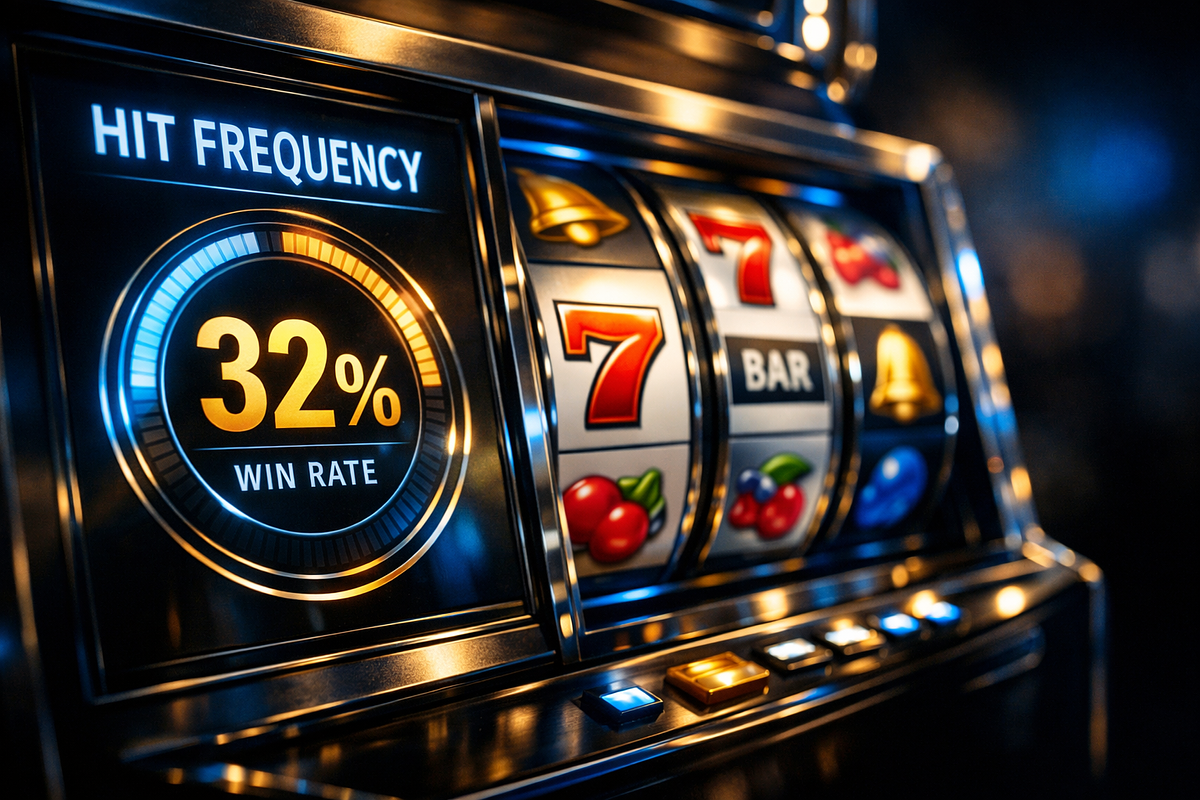
Hit frequency is expressed as a percentage and measures how often a spin produces any winning outcome. It says nothing about the size of those wins or how much money you can expect back over time. This page explains what the figure means, where it falls short, and how it relates to volatility and RTP, since those three numbers only make sense when read together.
What Hit Frequency Actually Measures
Hit frequency tells you how often a slot produces any winning outcome, expressed as a percentage. You’ll see it in game info panels, provider documentation, and third-party review sites, which makes it one of the more visible numbers you’ll come across when researching a game. This section covers what it measures and the typical ranges across online slots.
Hit frequency is the percentage of spins on which a slot produces any winning outcome. You calculate it by dividing the number of winning spins by the total number of spins, then converting that to a percentage.
That percentage tells you how often wins show up. A hit frequency of 20% means a winning combination appears, on average, once every five spins. You can apply the same logic to any figure you see: divide 100 by the stated percentage to get the average number of spins between wins.
What the figure doesn’t tell you is what those wins are worth. It counts only whether a winning outcome occurred, not whether it paid anything meaningful. A spin that returns less than your stake still counts as a win for this calculation. So hit frequency answers one question: how often does the game register a win? It doesn’t answer whether those wins are worth having.
Hit frequency is fixed by game design and doesn’t change during play. Knowing where a specific figure sits relative to other games on the market helps you judge whether a stated hit frequency is unusually low, about average, or toward the high end.
Here’s a rough framework for reading any hit frequency figure you come across:
- Low band: figures below 20%, indicating wins occur less frequently than the market norm
- Typical band: 20% to 30%, the range in which most online slot games fall
- Standard upper band: up to 35%, consistent with the range reported for standard slots
- High band: figures above 35%, less common and found in games specifically designed for frequent, smaller-return outcomes
What Hit Frequency Does Not Measure
The biggest limitation of hit frequency isn’t what it captures, it’s what it leaves out. The metric records whether a winning outcome occurred, not what that outcome was worth. Two things fall outside its scope: payout size and how well the figure holds up over any individual session.
Hit frequency counts each winning spin once, regardless of what it pays. A spin that returns CAD 0.10 on a CAD 2.00 stake counts the same as one that returns CAD 200.00. Because of this, a game with a very high hit frequency can return less money in total than a game with a very low hit frequency, if the wins in the high-frequency game are small enough. A game landing a winning outcome on 99% of spins could theoretically return less than a game landing one on 2% of spins, depending entirely on what those wins pay.
This becomes clearer when you consider what are often called losses disguised as wins. These are spins the game registers as wins, and counts toward the hit frequency figure, but where the payout is smaller than the stake. You end the spin with less money than you started with, yet the outcome still increments the win counter. A high hit frequency figure tells you only how often the game produces something it classifies as a win. It carries no information about whether those outcomes return more, less, or the same as what you wagered.
Hit frequency is a long-run statistical property, calculated from the game’s full probability distribution across hundreds of thousands of spins. A stated figure of 8% means the game lands on a winning combination about 8% of the time over that full theoretical sample, not that any realistic session will land close to that rate.
In a session of a few hundred spins, your observed win rate can diverge substantially from the published figure in either direction. That’s expected variance, not a sign that the stated figure is wrong or that the game is misbehaving. When your session results don’t match the published hit frequency, the published figure is still valid. The session is just too short to produce a reliable approximation of it.
Hit Frequency in Relation to Volatility and RTP
Hit frequency doesn’t work well as a standalone number. Its meaning shifts depending on the game’s volatility and RTP, and reading it in isolation gives you an incomplete picture. The two sections below look at each relationship in turn, followed by a comparison table that lays out what each metric measures, what it doesn’t, and how to use it.
High-volatility slots tend to have low hit frequency paired with larger individual payouts. Low-volatility slots tend to have high hit frequency paired with smaller payouts. These two properties move in opposite directions by design: the payout structure that produces infrequent but large wins is the same structure that reduces how often any winning outcome appears.
Games built around large progressive jackpots sit at the low-hit-frequency end of this pattern. The jackpot contribution compresses the frequency of ordinary wins, which is a direct result of how the prize pool is funded across the game’s full payout distribution.
A stated hit frequency figure gives you a partial signal about payout shape, but only when you read it alongside the volatility classification. Without that pairing, a low hit frequency number is ambiguous: it could mean rare but substantial wins, or it could just mean an unfavourable overall distribution. Volatility is what resolves that ambiguity. Volatility itself, though, doesn’t tell you how much money the game returns to players over time. That’s what RTP covers.
RTP measures the proportion of total wagered money that a game is designed to return to players over a long run of play. Hit frequency measures how often a winning outcome appears. These are different things: one describes how often wins occur, the other describes how much value comes back.
A game can register a winning outcome on a high proportion of spins while still returning less money per dollar wagered than a game with a far lower win rate, because hit frequency assigns no weight to the size of each payout. A favourable hit frequency figure tells you nothing about long-term returns. RTP is the figure that speaks directly to expected value over time.
Hit frequency figures also aren’t consistently published by software developers, which limits their usefulness as a reference point. RTP, by contrast, is more widely disclosed and gives you a more reliable basis for comparing expected returns across games.
These three metrics describe different properties of the same slot game and are often confused with one another. The table below sets out what each one measures, how it’s expressed, what it doesn’t capture, the time horizon over which it becomes reliable, and how to use it when assessing a game.
| Dimension | Hit Frequency | Volatility | RTP |
|---|---|---|---|
| What it measures | The percentage of spins on which any winning outcome is registered | The spread and size distribution of payouts: how clustered or dispersed wins are around the average | The proportion of total wagered money expected to be returned to players over the long term |
| Typical expression | A percentage; standard slots typically fall in the 20%–35% range | A qualitative label (low, medium, high) or a numerical volatility index | A percentage of total wagers; commonly expressed to two decimal places |
| What it does not measure | The size or value of winning outcomes; long-term money returned to the player | The proportion of wagered money returned to players; how much a machine earns for the operator | How often wins occur; the distribution shape of individual payouts |
| Time horizon for reliability | Calculated over hundreds of thousands of spins; individual sessions will not reliably mirror the stated figure | A design-level property that describes payout shape across the full theoretical cycle, not observable within a short session | A long-run statistical property; short sessions produce results that diverge substantially from the stated percentage |
| Interpretive use for the reader | Signals how often wins appear, not their worth; useful only when read alongside volatility | Contextualises hit frequency by indicating whether infrequent wins are paired with large payouts or frequent wins with small ones | The primary metric for comparing expected long-term value across games; not a session-level predictor |
Interpretive Limits of the Hit Frequency Figure
Hit frequency has two practical constraints that affect how much you can rely on it. The first is about what the figure counts, specifically whether every registered win represents a real gain. The second is whether the figure is even available to look up. Both affect what you can reasonably conclude from a stated percentage.
Hit frequency counts any outcome the game registers as a win, including outcomes where the payout is smaller than the stake. These outcomes, commonly called losses disguised as wins, increment the hit frequency counter without improving your balance. The stated percentage therefore overstates how often spins are genuinely profitable from your perspective.
Video poker illustrates this clearly. Its hit frequency approaches 45%, which looks like nearly half of all hands produce a favourable result. In practice, a substantial share of those registered wins return only the original stake. The player ends the hand in the same position they started. A figure close to 45% can conceal that the proportion of hands which actually move the player’s balance forward is considerably lower. A high hit frequency figure doesn’t confirm that winning outcomes are net-positive. It confirms only that the game registers them as wins.
Hit frequency information isn’t consistently published by software developers. For many games on the market, no stated figure exists in documentation, game info panels, or third-party sources. This is a market-wide condition, not something specific to individual titles, so the absence of a published figure for a given game tells you nothing about that game’s behaviour or integrity.
The practical result is that comparing games using hit frequency is often impossible, even when you want to use the metric. When a figure isn’t available, volatility descriptions, RTP figures, and payout structure are the remaining reference points. None of these is a direct substitute, since each measures something different, but together they give you a partial picture of how a game distributes its outcomes. The absence of a hit frequency figure is the default condition for much of the market, not an exception.
Reading a Slot’s Stated Metrics With the Correct Mental Model
Hit frequency describes one dimension of a game’s design: how often wins occur. It says nothing about payout size or long-run returns. Those come from other metrics. If you keep that boundary clear, you can look at a stated hit frequency figure and know exactly what it confirms, what it leaves open, and which other figures you need before drawing conclusions about how a game behaves.
We check operator terms, licences and payment details against the casino's own pages and update this content when they change. Read our editorial policy, our transparency statement, or report an error. If gambling stops being fun, see our responsible gambling resources.