

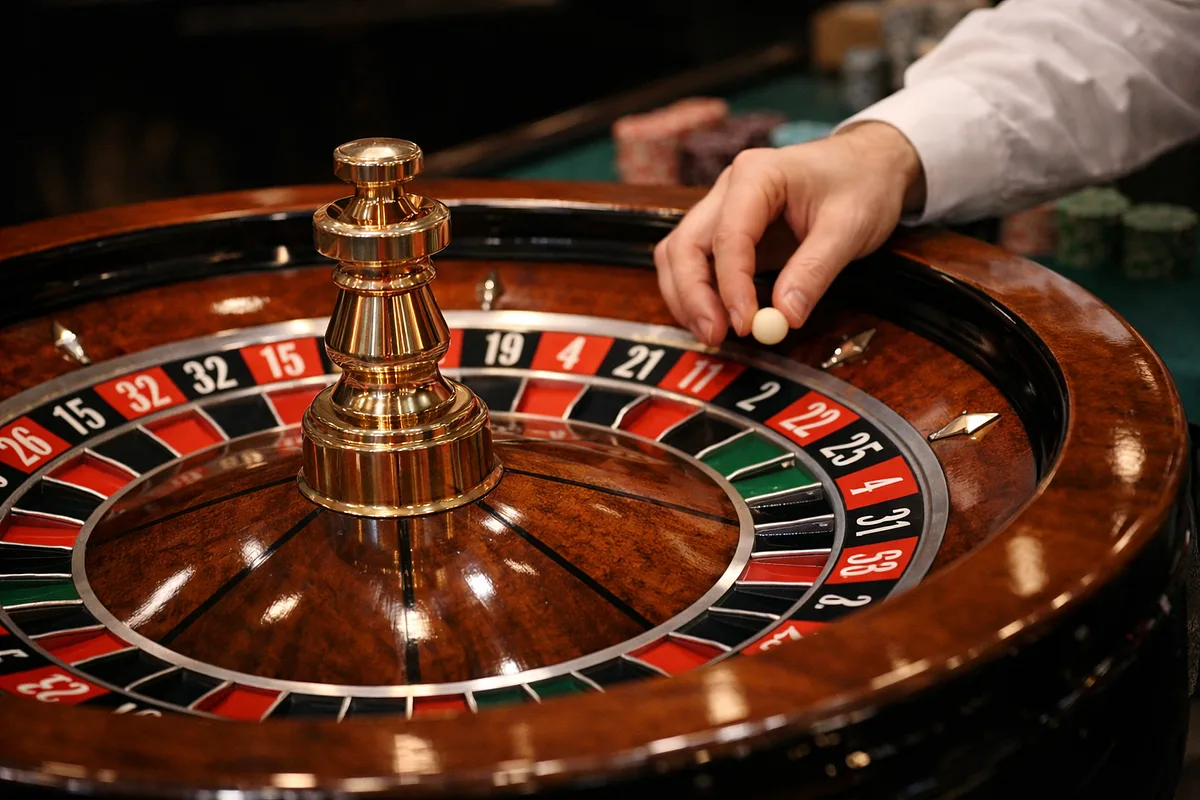
To figure out what roulette actually costs you per hour, you need to look at three things together: bet size, spin frequency, and house edge. None of them works on its own. Picking a European wheel over an American one, for example, only tells part of the story. This article walks through how those three inputs interact across different wheel formats and table speeds, and how to use that relationship to estimate what a session is likely to cost you. By the end, you’ll have a clear basis for comparing table options and making smarter decisions about where and how you play.
Calculating expected loss per hour isn’t a single-number problem. It’s the result of three variables working together: bet size, spin frequency, and house edge. Each of those inputs can change independently, and because they multiply together, wheel type alone doesn’t tell you what a session costs. This article covers how the three inputs combine across wheel formats and table speeds, and how to read that interaction to estimate hourly cost accurately.
The Three-Variable Formula That Governs Hourly Cost
Expected hourly loss in roulette is the output of a formula that combines three independently variable inputs: bet size, spin frequency, and house edge. Each input can change without the others changing, and the result shifts proportionally whenever any one of them does. Once you understand how these three things interact, hourly cost becomes predictable rather than mysterious.
The formula is: Bet Size × Rounds per Hour × (House Edge ÷ 100). The three variables multiply together, which means a proportional change in any single input scales the entire result by the same proportion. Double the spin frequency and you double the hourly cost, just as doubling your bet size would.
This is why anchoring your thinking to house edge alone will consistently underestimate what a session actually costs. House edge only tells you the per-spin cost as a percentage of each euro wagered. Hourly cost is that per-spin cost repeated at whatever rate the table produces. If you know the edge figure but not the spin rate, you only have one of the three inputs you need.
So a statement like “the house edge is 2.70%” is incomplete as a description of hourly cost. The same edge figure produces very different hourly losses depending on how large each bet is and how many spins the table generates. All three inputs need to be in the picture before the formula gives you a useful number.
The formula gives you a long-run theoretical average, not a guaranteed result for any individual session. Over a short session, the spread of outcomes can be large relative to the expected loss figure, so your actual result may land well above or below what the formula predicts.
That gap between theoretical expectation and short-run reality comes from variance, the natural spread of outcomes across individual spins. In a small number of spins, variance dominates. The formula’s prediction only becomes more accurate as spin count grows over many sessions.
If you treat the expected loss figure as a guaranteed session cost, you’ll misread both outcomes: a winning session looks like it contradicts the formula, and a big losing session looks like it confirms it more strongly than the math actually supports. The formula describes where results converge over time, not where any single session will land.
House Edge by Wheel Type as the Fixed Structural Input
House edge is the one variable in the hourly cost formula that you can’t adjust through strategy, bet selection, or timing. It’s set entirely by the physical or software architecture of the wheel, specifically how many pockets it has and which rules govern losing bets. It applies uniformly to every euro wagered on a standard wheel, regardless of which bet type you choose. Three distinct wheel formats exist, and their edge values are different enough that the per-euro cost of play is not remotely equivalent across them. Choosing a wheel format is the single structural decision with the largest fixed consequence for long-run cost.
Each of the three wheel formats sits in a separate cost tier, and the gap between tiers is fixed per euro wagered. You can’t negotiate it away through bet selection or session management. The lowest tier applies only to a specific subset of bets, which limits how broadly that advantage can be used in practice.
| Wheel Format | House Edge (%) | Applies To |
|---|---|---|
| Single-zero (European) | 2.70% | All standard bets |
| Double-zero (American) | 5.26% | All standard bets |
| Single-zero with la partage or en prison rule (French) | 1.35% | Even-money bets only |
On a standard single-zero wheel, the house edge is 2.70% per euro wagered across every bet type without exception. Straight-up single numbers, red/black, dozens, and columns all carry the same per-euro cost. The reason is that the edge comes from the ratio of zero pockets to total pockets, a ratio fixed by the wheel’s physical structure that has nothing to do with how individual bets are structured or what payouts they carry. Outside bets like red/black are not cheaper to play in expected-value terms than inside bets like straight-ups. They differ in variance and hit frequency, not in per-euro cost. Players who treat outside bets as structurally safer are confusing lower variance with lower cost. Those are two different things. The 1.35% edge on a French wheel is a genuine cost reduction, but it applies only to even-money bets. Any other bet on that same wheel reverts to the standard 2.70% rate, so you need to account for that scope restriction precisely when estimating session cost.
Spins Per Hour and What Makes Table Speed Variable
Spin frequency is the input that most directly controls how quickly the house edge turns into actual money lost, yet it’s the variable players are least likely to track or even notice. It’s not fixed by the wheel type or the rules of the game. It shifts with the format you’re playing and with the conditions at that specific table. Two players placing identical bets on identical European wheels can end up with very different hourly costs simply because one table runs faster than the other. Knowing the range of speeds a given format can produce is what lets you move from knowing the house edge to estimating what a session will actually cost.
A live dealer roulette table commonly runs at around 45 spins per hour, though estimates in the research literature range from about 35 to over 100 spins per hour depending on conditions. Automated and electronic roulette formats produce higher spin frequencies than dealer-run tables, though no single verified figure applies uniformly across all electronic variants. The factors that drive this variation in dealer-run games are identifiable: a full table with many players placing complex multi-area bets takes longer to settle than a table with few players making simple wagers. Dealer pace adds further variation. Procedural pauses, like resolving disputes, paying out multiple bet types, or waiting for late bets, add time between spins. Because the same wheel type can span this entire speed range depending on format and conditions, quoting a single spins-per-hour figure for “roulette” without specifying the format gives you an unreliable hourly cost estimate.
Dealer-run roulette generates fewer decisions per hour than most other major table games, which means its house edge is applied to each wagered euro less frequently per hour than in faster games. The comparison below uses figures from established pre-research sources.
| Table Game | Approximate Decisions per Hour |
|---|---|
| Dealer-run roulette | ~45 |
| Blackjack | ~60 |
| Craps | ~100 |
How Wheel Type and Speed Interact to Produce Hourly Cost
Neither wheel type nor speed alone determines what a session costs per hour. Bet size, spins per hour, and house edge all multiply together, so a change in either wheel type or speed scales the total result in proportion to the other. This produces outcomes that can contradict the intuition that a lower-edge game is always the cheaper game. You have to read the two inputs together, because their product is what generates the actual hourly cost figure.
A lower-edge game played at high speed can produce a greater hourly loss than a higher-edge game played slowly. Hourly cost is the product of edge and spin frequency, so a proportional increase in speed scales the total cost upward by exactly the same factor as a proportional increase in edge would. If one game runs at twice the spin rate of another, it only needs half the edge to produce the same hourly cost. If its edge is more than half, it costs more per hour despite the lower percentage.
This means a player choosing between a European wheel at a fast automated table and an American wheel at a slow live-dealer table can’t determine the cheaper session from edge figures alone. The European wheel carries a 2.70% edge against the American wheel’s 5.26%, but if the European table runs at a materially higher spin frequency, the edge advantage narrows or reverses in hourly cost terms. Ranking games by house edge percentage without accounting for speed will consistently produce the wrong answer when comparing two tables running at different rates.
A peer-reviewed study published in Addictive Behaviors (Newall et al., 2022) tested the causal effect of spin frequency on gambling expenditure in an online roulette experiment. When a speed-of-play limit of one spin every 60 seconds was enforced, participants gambled a credibly lower proportion of their funds compared with the unrestricted condition, with the reduction driven by fewer spins rather than by changes in bet size. This is direct experimental evidence that spin frequency is a first-order driver of realised loss, not a neutral background parameter. The finding confirms that the formula’s treatment of speed as an equal-weight variable alongside edge and bet size reflects observed behaviour, not only theoretical arithmetic.
Worked Euro-Figure Comparisons at a Standardised Bet Size
Applying the expected-loss formula to a fixed bet size of €10 per spin converts the abstract relationship between edge, speed, and cost into concrete, comparable figures. With bet size held constant, the only variables separating the three wheel formats are house edge and spin frequency. The figures below use 50 spins per hour as the common speed benchmark for the hourly table and 1,000 total spins for the cumulative table, so you can see directly what wheel selection alone costs over time.
At a standardised speed of 50 spins per hour, the difference in house edge between wheel formats translates directly into a difference in hourly cost, with no change in the playing experience or potential payouts to offset it. The French wheel with the la partage rule carries the lowest edge of the three formats, but no verified hourly figure at exactly 50 spins per hour is available for it. Its cost at that speed sits below the European figure in proportion to its lower edge, and applies only to even-money bets.
| Wheel Format | Bet per Spin | Spins per Hour | Expected Hourly Loss |
|---|---|---|---|
| European (single-zero) | €10 | 50 | €13.50 |
| American (double-zero) | €10 | 50 | €26.30 |
| French with la partage (even-money bets) | €10 | 50 | Below €13.50; approximately half the European rate at equivalent speed |
Because expected loss scales linearly with spin count, the euro gap between wheel formats grows at a constant rate with every additional spin. Moving from the American to the European wheel doesn’t just save you money on each individual spin; the saving adds up across the full session. The French format’s advantage over the European wheel widens by the same proportional margin at every spin milestone, though that advantage is conditional on placing even-money bets throughout.
| Wheel Format | Bet per Spin | Total Spins | Cumulative Expected Loss |
|---|---|---|---|
| European (single-zero) | €10 | 1,000 | €270 |
| American (double-zero) | €10 | 1,000 | €526 |
| French with la partage (even-money bets) | €10 | 1,000 | Approximately €135; roughly half the European cumulative figure and one quarter of the American figure |
We check operator terms, licences and payment details against the casino's own pages and update this content when they change. Read our editorial policy, our transparency statement, or report an error. If gambling stops being fun, see our responsible gambling resources.