

Jacks or Better video poker RTP with optimal strategy reaches 99.54% on the full-pay 9/6 variant.
Getting the 99.54% RTP in Jacks or Better video poker requires two things at the same time: playing on a full-pay 9/6 machine and using the best hold-or-discard strategy on every hand. The 9/6 pay table (9 coins for full house, 6 for flush) sets the top possible return at 99.54%, but only perfect strategy gets you there. This article explains how to check the pay table, the complete strategy ranked by expected value, and the max-coin requirement that activates the non-linear royal flush payout structure. It shows exactly where the 0.46% house edge comes from and how mistakes in strategy lower your return.
How the 0.46% House Edge Is Distributed Across Outcomes
The 0.46% house edge is a long-run average. The return doesn’t come evenly across hands, and how it’s spread out affects how your sessions go.
The royal flush makes up roughly 1.98% of total return, even though it only shows up about once every 40,391 hands when you play perfectly. A big chunk of the game’s return is tied up in one rare event. You can play thousands of hands without hitting a royal flush and still be doing everything right. Not hitting it doesn’t mean you made a mistake.
On the other end, a pair of Jacks or better comes up roughly once every 4.83 hands. These small, frequent payouts keep your bankroll from swinging wildly between bigger events. They balance out how rarely the royal flush appears.
The variance for full-pay 9/6 Jacks or Better is about 19.51, which puts it at the low end of the video poker variance range. In practice, your bankroll will move more smoothly here than on higher-variance video poker games. That said, you’ll still have losing stretches over thousands of hands. The theoretical return depends on rare big events, and short-run results don’t match the theoretical return.
Strategy Tier Sensitivity: Why 99.54% Requires Optimal, Not Approximate, Play
There are three documented strategy tiers for full-pay 9/6 Jacks or Better. Each one trades a small amount of return for easier memorization. Wizard of Odds lays this out clearly: a simplified strategy returns about 99.46%, an intermediate strategy returns about 99.52%, and the full optimal strategy returns 99.54%.
The gaps are small in absolute terms. The difference between the simplified and optimal strategies is 0.08 percentage points. But the structure makes one thing clear: the RTP you’re playing at is always tied to a specific set of decisions. If you’re using a simplified chart, you’re not playing at 99.54%. You’re playing at a slightly lower return that’s still good, but it’s not the same number.
This matters because picking the right game doesn’t automatically get you the theoretical return. The pay table sets the ceiling. The strategy tier decides how close you get to it. Quoting 99.54% without saying which strategy tier produced it is as incomplete as quoting it without specifying the pay table.
Reading the Pay Table to Confirm You Are on a 9/6 Machine
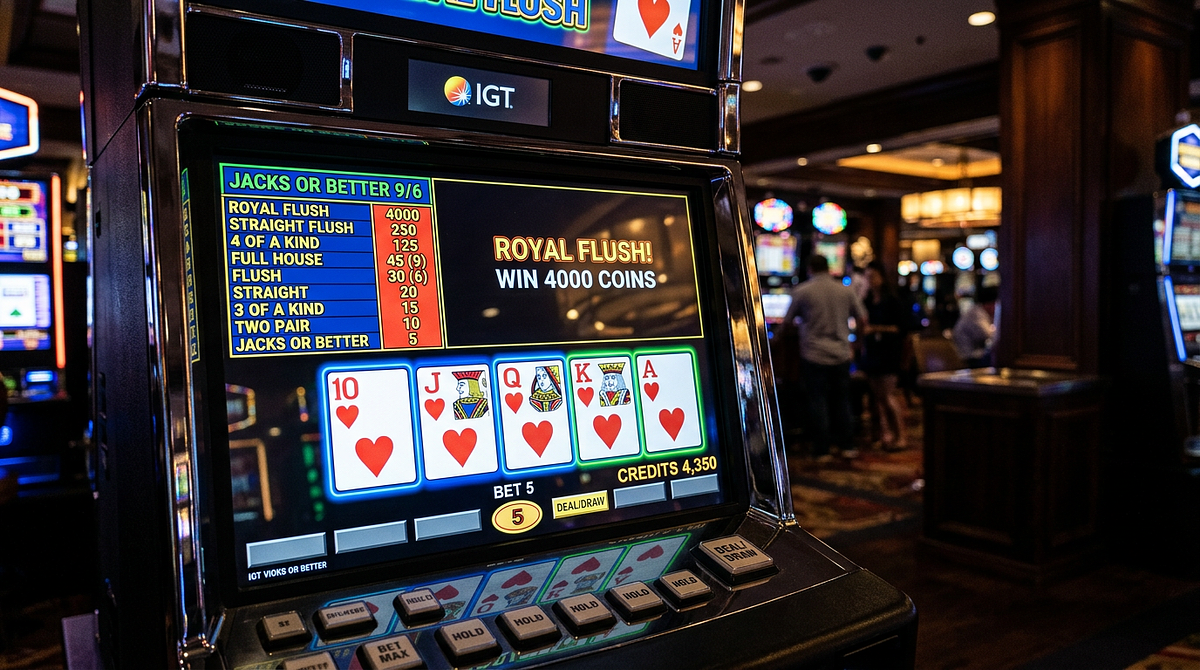
The “9/6” label isn’t a brand name or a marketing term. It refers to two specific lines in the pay table. At the 1-coin bet level, a full house pays 9 coins per coin wagered, and a flush pays 6 coins per coin wagered. Every other payout line, including straight flush, four of a kind, straight, three of a kind, two pair, and jacks or better, is usually the same across all Jacks or Better variants, no matter what the return is.
That means the full house and flush rows are the only two numbers that tell you which version of the game you’re actually playing. The game’s name, its visual design, and the software brand tell you nothing about the pay table.
The Pay Table Comparison Across Short-Pay Variants
Operators often run short-pay variants under the exact same “Jacks or Better” name with an identical look to the full-pay version. The only difference is in the full house and flush rows. Each one-unit reduction in either row cuts the game’s return by about 1.1%, which adds up quickly across multiple downgrades.
A player who sits down at what looks like standard Jacks or Better could be facing a house edge several percentage points higher than the 9/6 baseline, with no visual sign that the game has changed. Just asspecific rule sets in blackjack shift the house edge by measurable percentages, pay table variations in video poker produce predictable and big changes in expected return, as the comparison below shows.
|
Pay Table (Full House / Flush) |
Optimal-Strategy RTP |
House Edge |
|---|---|---|
|
9 / 6 |
99.54% |
0.46% |
|
8 / 5 |
~97.30% |
~2.70% |
|
7 / 5 |
96.15% |
3.85% |
|
6 / 5 |
~95.00% |
~5.00% |
Progressive 8/5 Variants and When They Become Competitive
A progressive royal flush jackpot attached to an 8/5 pay table pushes the effective return above the flat-pay 8/5 baseline of about 97.30%, because the growing jackpot adds expected value to every hand that could turn into a royal flush. The return isn’t fixed. It goes up as the jackpot meter climbs.
Two credit thresholds matter when comparing against the 9/6 baseline. At roughly 8,000 credits on the royal flush jackpot, the 8/5 progressive reaches a return about equal to a flat-pay 9/6 machine. At roughly 9,000 credits, the game crosses 100% expected return, meaning the math edge shifts to the player. Research shows that adding about 1,000 credits beyond that point pushes the return to around 100.2%.
Both thresholds assume max-coin play and optimal strategy, the same two conditions required to hit 99.54% on a flat 9/6 machine. A progressive jackpot also brings higher variance: a larger share of the game’s total expected return is packed into one rare outcome.
Even when the math is in your favor, the bankroll you need to ride out normal downswings while waiting for that outcome is much larger than on a flat-pay game. A big progressive jackpot isn’t automatically better than a fixed-return 9/6 machine. The comparison depends on the current jackpot level and whether your bankroll can handle the variance that comes with it.
The Max-Coin Requirement and Its Effect on Effective Return
The 99.54% RTP figure for full-pay 9/6 Jacks or Better only applies when you wager 5 coins per hand, not 1, 2, 3, or 4. The reason comes down to the royal flush payout structure. At 1 through 4 coins, the royal flush pays 250 coins per coin wagered, scaling in a straight line. At 5 coins, it pays 4,000 coins total.
That’s a non-linear jump that packs a lot of the game’s theoretical return into the max-coin tier. Coin denomination and coins-per-bet are two separate decisions. Dropping your coins-per-bet to stretch a session bankroll doesn’t just lower your stakes. It changes the return of the game you’re playing.
The Non-Linear Royal Flush Payout and the Sub-Max-Bet Penalty
Playing fewer than 5 coins drops your effective RTP from 99.54% to about 98.01%, even with a perfect strategy. That 1.53 percentage-point gap comes entirely from the royal flush payout structure. At 1 to 4 coins, the royal flush pays at a rate of 250 coins per coin wagered. At 5 coins, the 4,000-coin total payout works out to an 800-coin-per-coin equivalent, more than three times the per-coin rate you get at sub-max bets. This isn’t a bonus or a promotional feature. It’s a structural property of how the pay table is designed.
The practical question is whether it’s better to play max coins at a lower denomination or fewer coins at a higher denomination. The answer is max coins at a denomination your bankroll can handle. Coin denomination scales the dollar value of each coin but doesn’t change the return percentage. Coin count does change the return percentage, because the royal flush payout is non-linear across the coin-count threshold.
A player wagering 5 coins at C$0.05 is playing the same 99.54% game as a player wagering 5 coins at C$0.25. A player wagering 2 coins at C$0.25 is playing a 98.01% game no matter what the denomination. The same logic applies to any video poker variant where the advertised return depends on a max-bet condition. The stated RTP is only possible when the top-prize payout structure is fully activated.
Bankroll Sizing to Sustain Max-Coin Play
The max-coin requirement creates a real bankroll constraint. A session bankroll in the range of 250 to 400 max bets, which works out to 1,250 to 2,000 total coins, is documented as a baseline enough to absorb normal downswings without forcing a mid-session drop to sub-max coins. This isn’t a wagering recommendation. It’s the math result of the game’s variance figure of 19.51 combined with how much return is packed into rare hands like the royal flush, which comes up about once every 40,391 hands when you play perfectly.
A player who sizes a session around an arbitrary time limit or a fixed spend amount risks running out of bankroll during a normal downswing and being forced to drop their coin count, which changes the game’s return when the bankroll is under pressure. Sizing against the variance figure instead produces a session length that’s structurally consistent with the return you’re trying to get. The same method applies to any video poker variant: once you know the variance figure, the bankroll requirement follows directly from it.
The Optimal Strategy Hierarchy by Expected Value
Optimal strategy for full-pay 9/6 Jacks or Better is a ranked list of possible held-card combinations. Each one has an expected value calculated by replacing the discarded cards from the remaining deck. On any dealt hand, the right play is to find the highest-ranked combination in your five cards and hold exactly those cards, nothing more, nothing fewer.
This isn’t a judgment call. The decision is a straight lookup: a given set of cards maps to exactly one correct hold. Any strategy chart is either built from expected-value enumeration, or it isn’t, and that’s what decides whether the chart produces 99.54% or something lower.
How the Expected-Value Ranking Is Derived
The ranking is built by going through every possible discard combination for every possible dealt hand and calculating the average return across all possible replacement draws. A five-card hand dealt from a 52-card deck produces a finite, countable set of discard options. For each option, every possible draw outcome is calculated and weighted by its probability. The resulting expected values are then sorted to produce the ranked list.
This calculation has been done in academic settings, including a documented derivation in a McMaster University thesis deposited in the MacSphere repository, and an arXiv paper listing the 387 largest values of the optimal conditional expected return for full-pay Jacks or Better. Independent work published by Wizard of Odds arrives at the same ranking.
That agreement across academic and independent sources is what makes the strategy “optimal” rather than just “recommended.” A strategy chart that lists hold rules without publishing the underlying expected values alongside them can’t be verified as equal to the enumerated result, and should be treated as a rough approximation rather than a confirmed optimal derivation.
The Ranked Hold Hierarchy from Strongest to Weakest
The table below lists every candidate holding for full-pay 9/6 Jacks or Better from highest to lowest expected value, expressed in units of the bet. On any dealt hand, find the highest-ranked hold present in your five cards and hold exactly those cards. This table is the reference chart for all hold decisions.
|
Rank |
Hold |
Expected Value |
|---|---|---|
|
1 |
Dealt a royal flush |
800.0000 |
|
2 |
Dealt a straight flush |
50.0000 |
|
3 |
Dealt four of a kind |
25.0000 |
|
4 |
4 to a royal flush |
18.3617 |
|
5 |
Dealt a full house |
9.0000 |
|
6 |
Dealt flush |
6.0000 |
|
7 |
Dealt three of a kind |
4.3696 |
|
8 |
Dealt straight |
4.0000 |
|
9 |
4 to a straight flush |
3.5319 |
|
10 |
Dealt two pair |
2.5957 |
|
11 |
High pair (Jacks or better) |
1.5374 |
|
12 |
3 to a royal flush |
1.4109 |
|
13 |
4 to a flush |
1.2766 |
|
14 |
Low pair (Tens or lower) |
0.8237 |
|
15 |
4 to an outside straight |
0.8723 |
|
16 |
2 to a royal flush (J, Q, K, or A, two suited high cards) |
0.6007 |
|
17 |
4 to an inside straight with 3 high cards |
0.6383 |
|
18 |
3 to a straight flush (type I) |
0.6378 |
|
19 |
3 high cards (suited or unsuited) |
0.5479 |
|
20 |
2 high cards (unsuited) |
0.4913 |
|
21 |
3 to a straight flush (type II) |
0.5686 |
|
22 |
1 high card |
0.4753 |
|
23 |
Discard everything |
0.3596 |
Resolving the Common Low-Pair-Versus-Four-to-a-Flush Decision
The low pair vs. 4-to-a-flush decision is where casual play most reliably breaks from optimal play. A low pair, tens or lower, is a made hand. It doesn’t pay anything yet, but it has drawing potential to three of a kind (EV 4.3696), a full house (EV 9.0000), or four of a kind (EV 25.0000). That drawing potential makes the low pair feel like the stronger hold, because you’re not starting from nothing.
Four to a flush, by contrast, is a drawing hand that pays zero if the fifth card doesn’t complete the flush. The flush itself pays 6 coins per coin wagered on a 9/6 machine. Despite that all-or-nothing structure, the flush draw’s expected value of 1.2766 is about 55% higher than the low pair’s expected value of 0.8237. The flush draw wins in expected-value terms because the probability of completing it (roughly 19.1%) multiplied by the flush payout beats the combined probability-weighted returns of the low pair’s draw outcomes.
The practical takeaway is straightforward: any time a dealt hand contains both a low pair and four cards to a flush, the correct hold is the four flush cards, breaking the pair. Playing by feel and keeping the pair in this spot will underperform the published chart. The same logic applies to any other close call in the hierarchy. The expected values decide, not how strong a made hand looks.
Locating Full-Pay 9/6 Games in the Canadian Online Market
Full-pay 9/6 Jacks or Better is not the default video poker offering at most online casinos. Short-pay variants, 8/5 and lower, are far more common because each one-unit reduction in the full house or flush payout adds about 1.1 percentage points to the house edge, which means a bigger margin for the operator. A Canadian player looking for the full-pay variant is doing a filtering job, not a browsing one.
From the set of online casinos legally accessible in their province, the relevant subset is those that offer a video poker product from a provider that publishes verified return figures and carry a pay table that can be confirmed as 9/6 before any wager is placed. “The casino offers Jacks or Better” and “the casino offers full-pay 9/6 Jacks or Better” are different claims. Only the second one, verified directly against the payout schedule, confirms that the 99.54% return is actually possible.
Verification Signals a Canadian Player Should Confirm Before Playing
The game’s title tells you nothing about the pay table. A short-pay 8/5 variant and a full-pay 9/6 machine can carry identical names, identical visual designs, and identical software branding. The only structural difference is in two payout rows: full house and flush. That’s where the verification has to happen, not in the marketing copy or the game’s label.
Advertised RTP figures carry the same limitation. A number presented without the “with optimal strategy” qualifier isn’t comparable to the 99.54% benchmark, because it doesn’t specify the decision framework that produced it. Online gambling access in Canada is province-specific, which adds a regulatory layer to the verification process that doesn’t exist in single-jurisdiction markets. The checklist below covers what to confirm before committing a bankroll.
- Pay table inspection: Open the game in demo or real-money mode and read the full house and flush payout rows directly. Confirm 9 and 6 coins respectively at the 1-coin bet level.
- Published RTP disclosure: Confirm the operator or game provider publishes an RTP figure of 99.54% (not 97.30%, 96.15%, or 95.00%) for the specific game title being offered.
- Independent testing reference: Confirm the game provider is audited by a recognized independent testing laboratory whose certification covers the video poker product line.
- Regulatory context for the operator: Confirm the operator holds a valid license for your Canadian province of residence, since online gambling access in Canada is province-specific.
- Strategy conditionality acknowledgment: Confirm any advertised RTP figure is presented alongside the “with optimal strategy” qualifier. Figures presented without that qualifier are not comparable.
Free-Play Access for Strategy Practice
The 99.54% return isn’t something you get by playing well in a general sense. It’s the precise output of three conditions working together: a confirmed 9/6 pay table, five coins wagered per hand, and hold decisions made from the ranked hierarchy rather than gut feel. Drop any one of those conditions, and the return shifts. To avoid this, reading the full house and flush rows directly, confirming the published RTP carries the “with optimal strategy” qualifier, and using free-play to build real-time recognition of the hold hierarchy, is what separates actually playing a 99.54% game from just believing you are.
We check operator terms, licences and payment details against the casino's own pages and update this content when they change. Read our editorial policy, our transparency statement, or report an error. If gambling stops being fun, see our responsible gambling resources.